5 tips to improve your development workflow with Chrome DevTools

Chrome has has the majority of the global browser market share with over 64% based on statscounter.com. That marketshare is also reflected in my friends and colleagues usage of the browser, but i tend to see that the capability of the features in the browser is not used or is rarely used.
Chrome and Chrome DevTools has been an essential tool in my toolbelt for as long as i remember. I’ve improved my development workflow in Chrome DevTools and expanded my toolbelt with these tips resulting in an overall productivity and efficiency. I find that these tips i’m sharing is something that keeps coming back whenever i help someone out, or something i’ve found really useful or is using on a daily basis.
Tip 1: Disable Cache
If you clear the cache rarely, then holding down the refresh button next to linkbar and press Empty Cache and Hard Reload is in my opinion the preferred way. If you need to clear the cache every time you refresh the site to make sure that the content displayed is up to date, then i think you will benefit from disable the cache in Chrome DevTools.
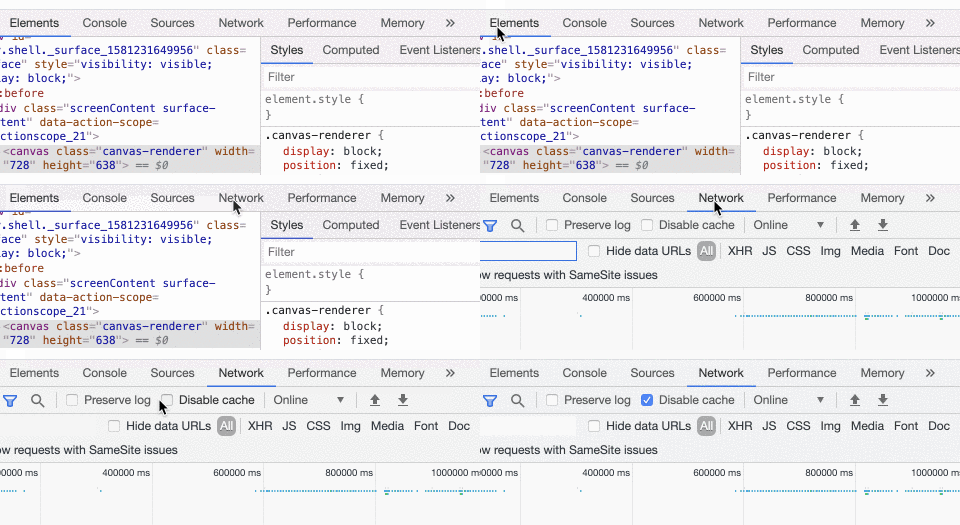
To do that you need to open Chrome Developer Tools -> Network tab -> Disable Cache. You find the disable Cache checkbox option right below the network tab. Remember that you are only disabling the cache when the Chrome DevTools is open. Now you can just reload the page, and the cache will be cleared in the browser.
Tip 2: Blackboxing files
Whenever i debug some code written in a frontend framework like Angular or a library like jQuery, i often step through some of the core files of the framework/libraries which i don’t want to pollute my debugging process. That means in order to debug 2 different custom javascript files, i have to jump into 5 core angular files controlling the rendering of elements in angular components, or how lifecycle hooks is defined behind the scene. Not ideal!
To solve this issue, you can right click on the file you want to ignore and press ‘blackbox script’. Now this file won’t be called when you debug your application. If you have an exception occurring in a blackboxed file, then it will not be skipped.
If you want to blackbox multiple files at once you can press f1 or the three dots in top right corner in DevTools and go to ‘Settings’.
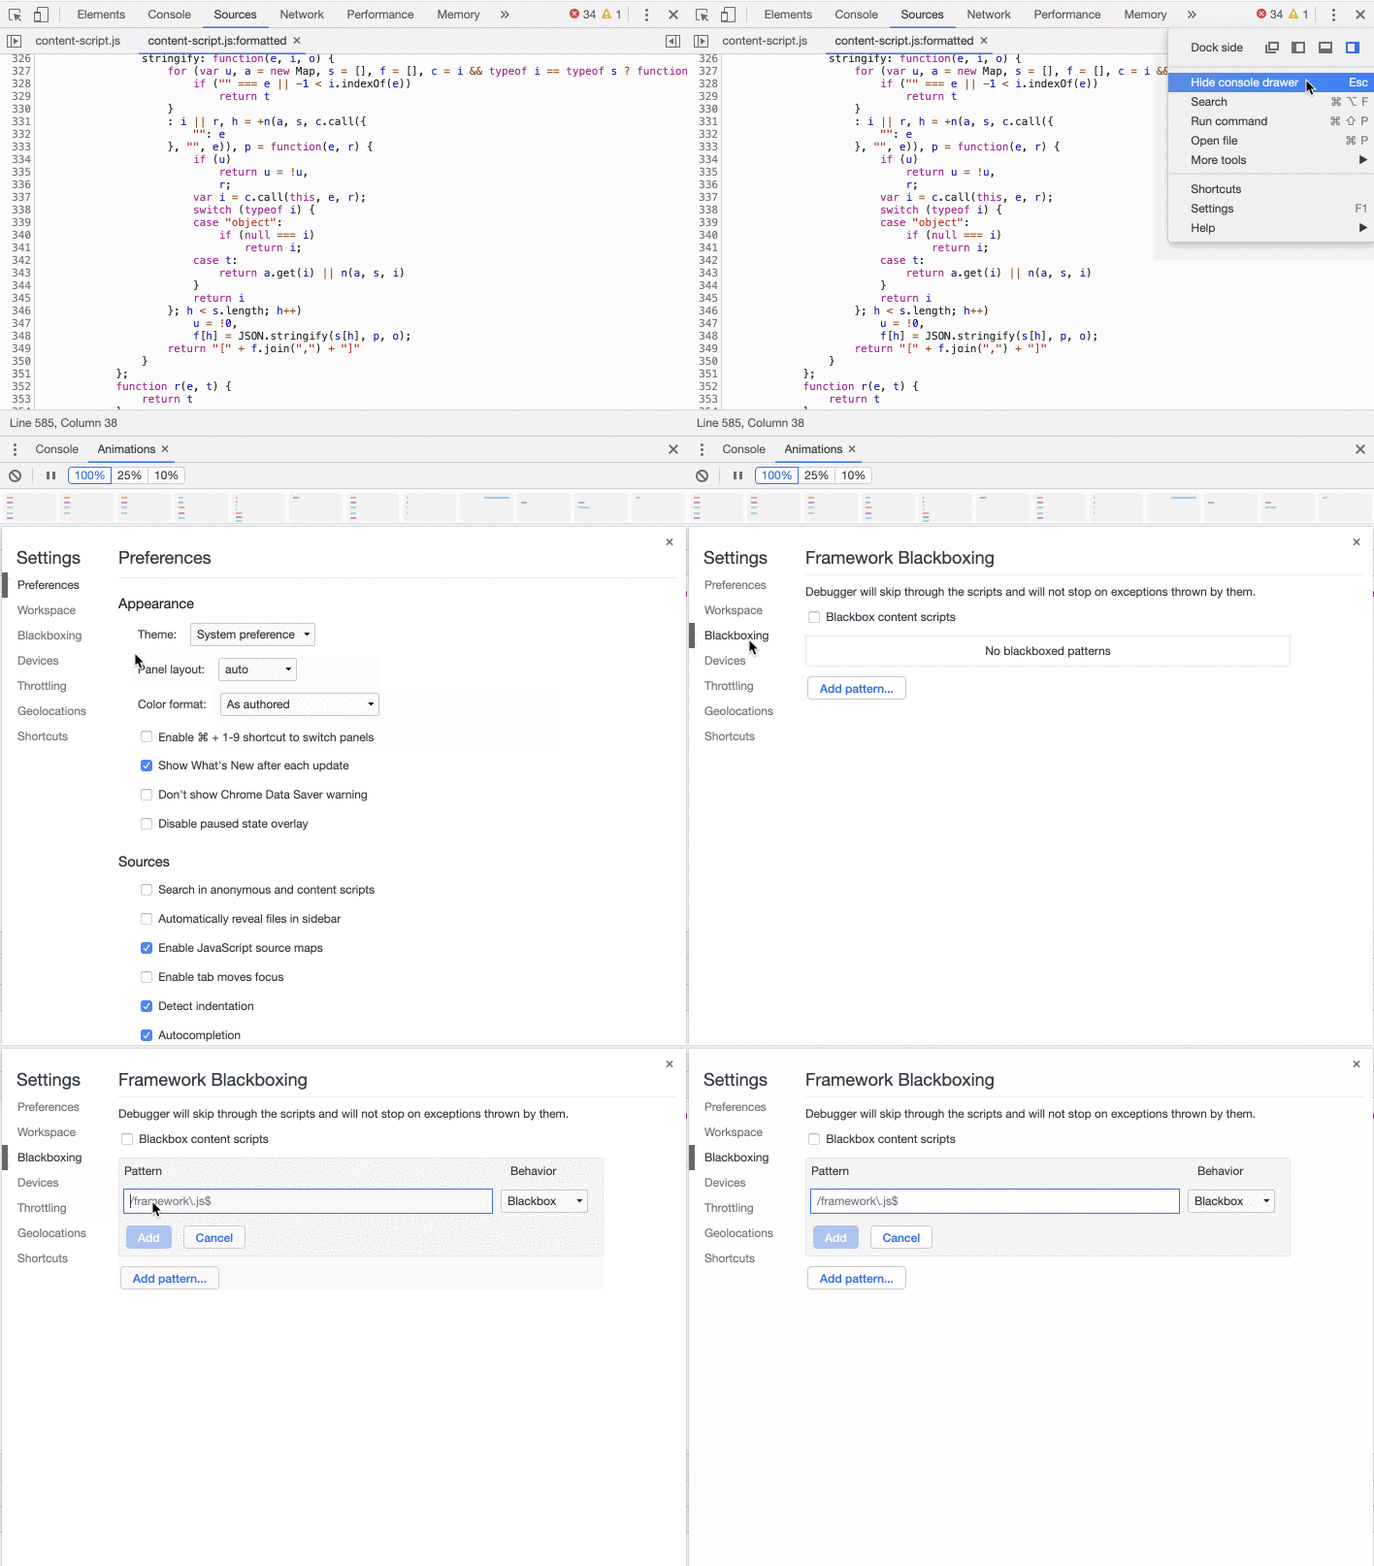
Then press Blackboxing in left menu, and press the ‘Add Pattern’ button. Now you should be able to insert a regex that can target your desired files to blacklist.
Tip 3: Unminify files
I find this tip useful for people who still is copying all the minified content of a file into an editor and unminify the content there. To unminify the content in Chrome DevTools, look right below the content of the file in the first toolbelt.
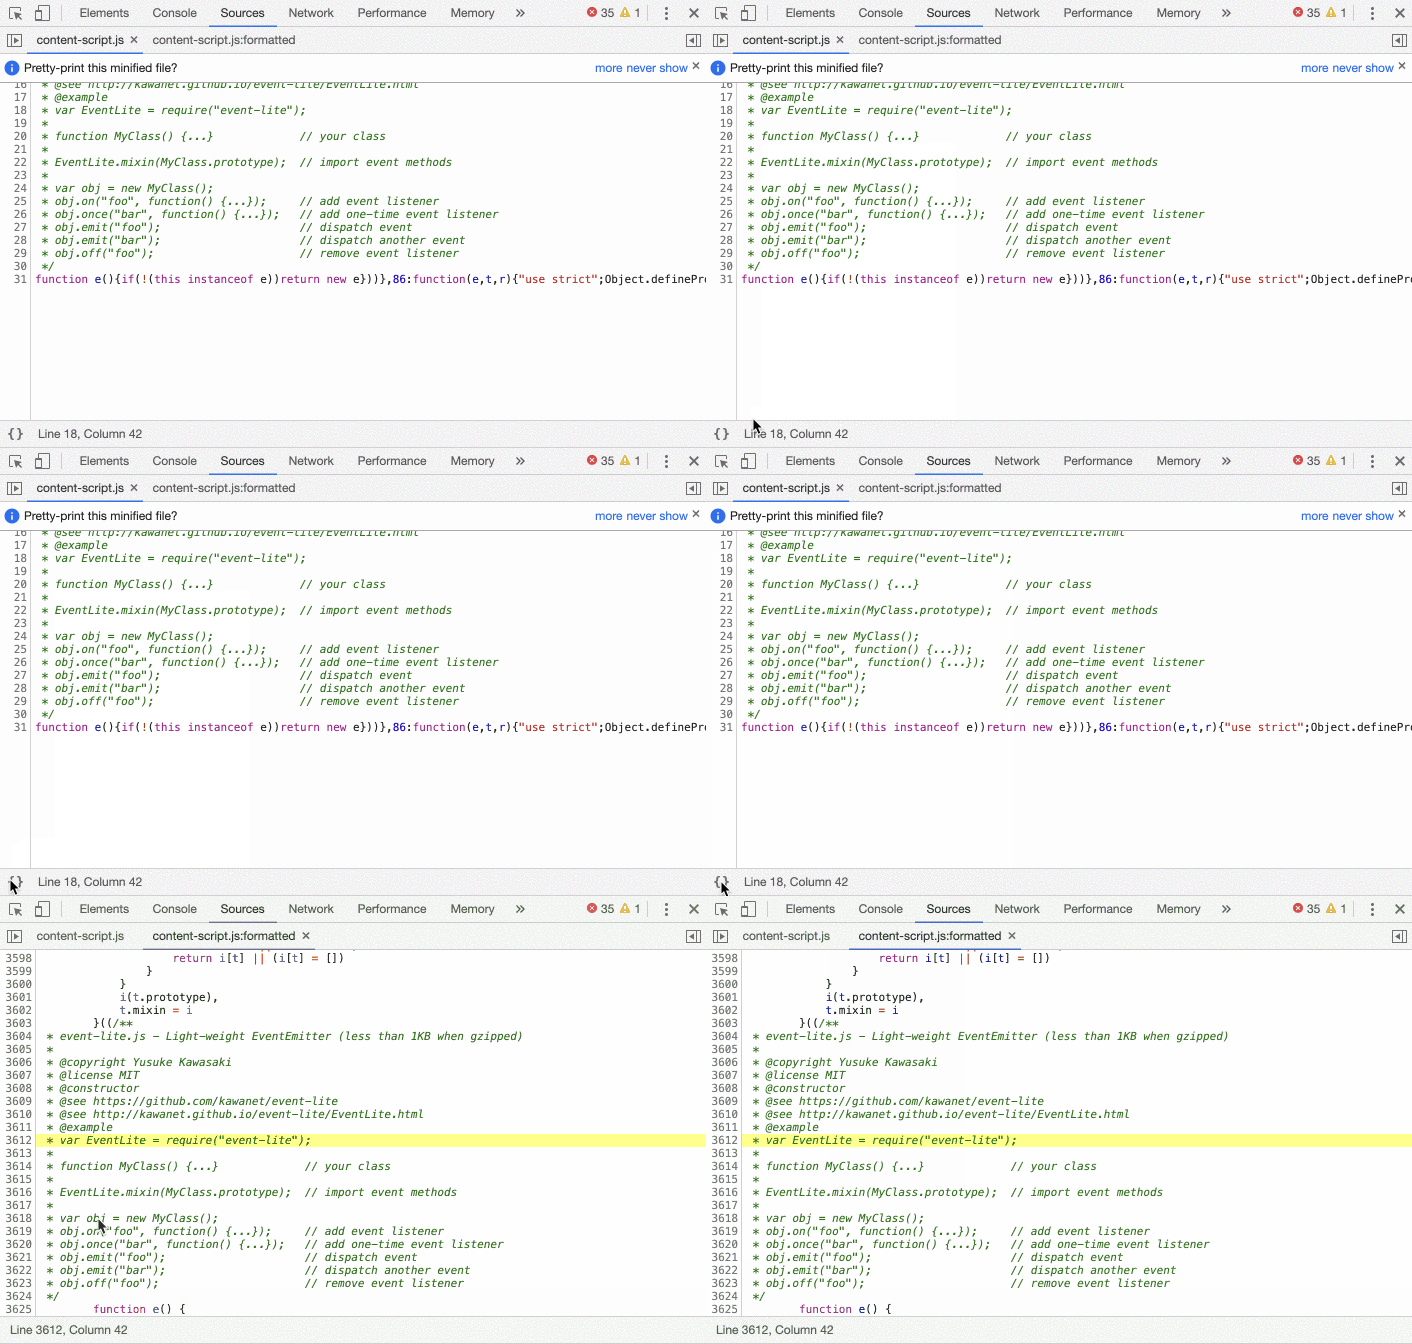
You will find 2 curly brackets on left side with a hover text ‘Pretty Print’. Click that button and all the content will be unminified.
Tip 4: box-shadow editor / cubic-bezier editor
Visualising how certain style will be applied to an element, can sometimes be difficult. For a developer that is also working as a designer, you are perhaps tweaking the code by 1 pixel to get just the design you want. When working with box shadows, multiple variables can make that styling of the property difficult and also very time consuming. If you at the same time dont have Hot Module Reloading or live reloading, then the amount of time spend is very high.
Chrome DevTools has this built in editor for box shadows that is just amazing!
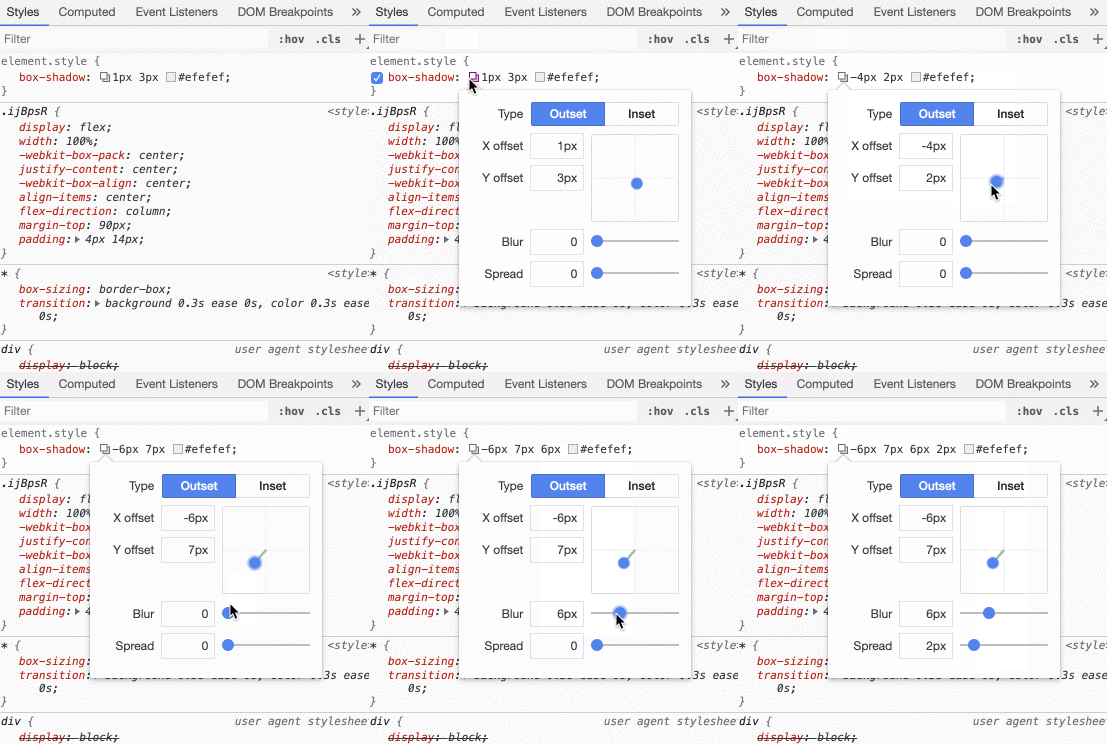
If you press the box next to the values, you have a live editor you can use and see the styling being applied to your element live. Pretty awesome.
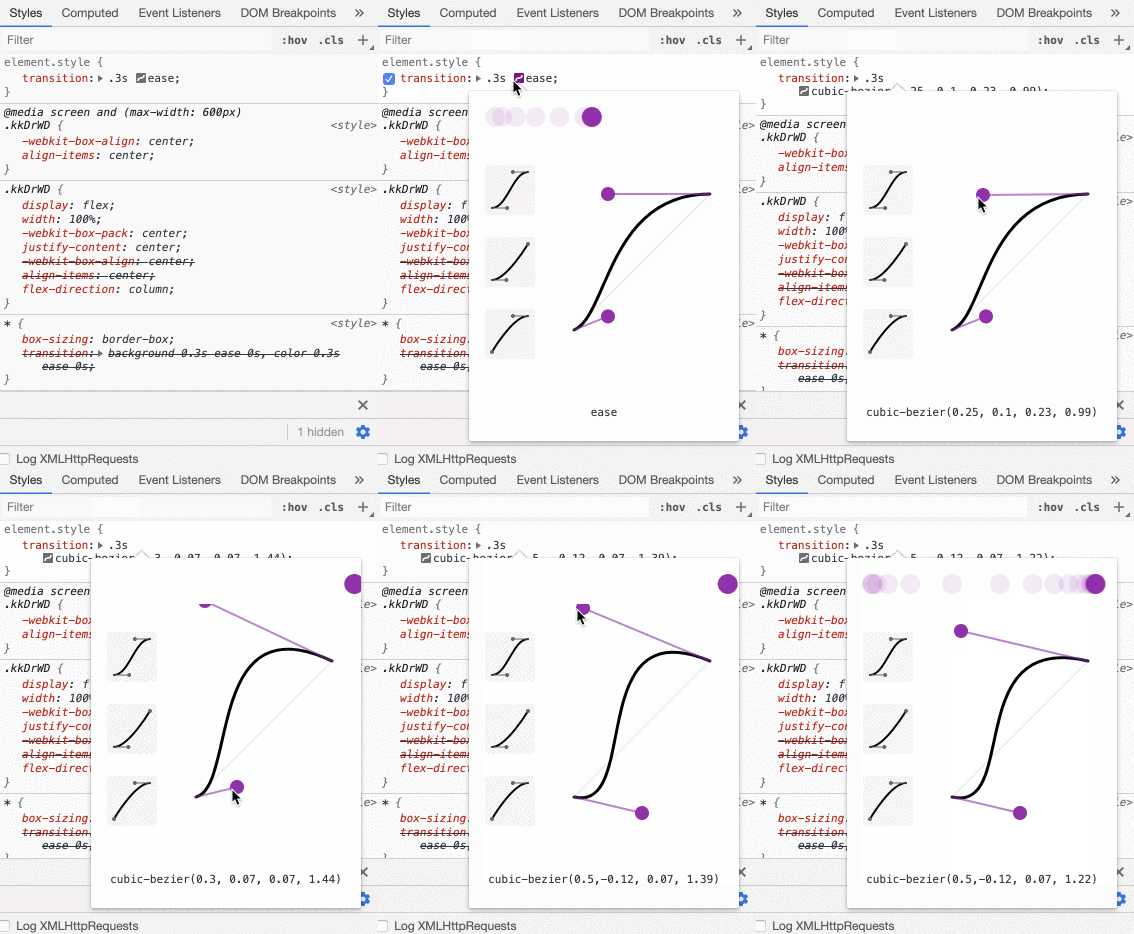
This concept of live editor is also used when applying an easing function to a transition.
As you see below, you can tweak the easing function for how the animation should occur. The purple ball sliding horizontal across the editor demonstrates how the animation looks based on your customization.
Tip 5: Debug animations
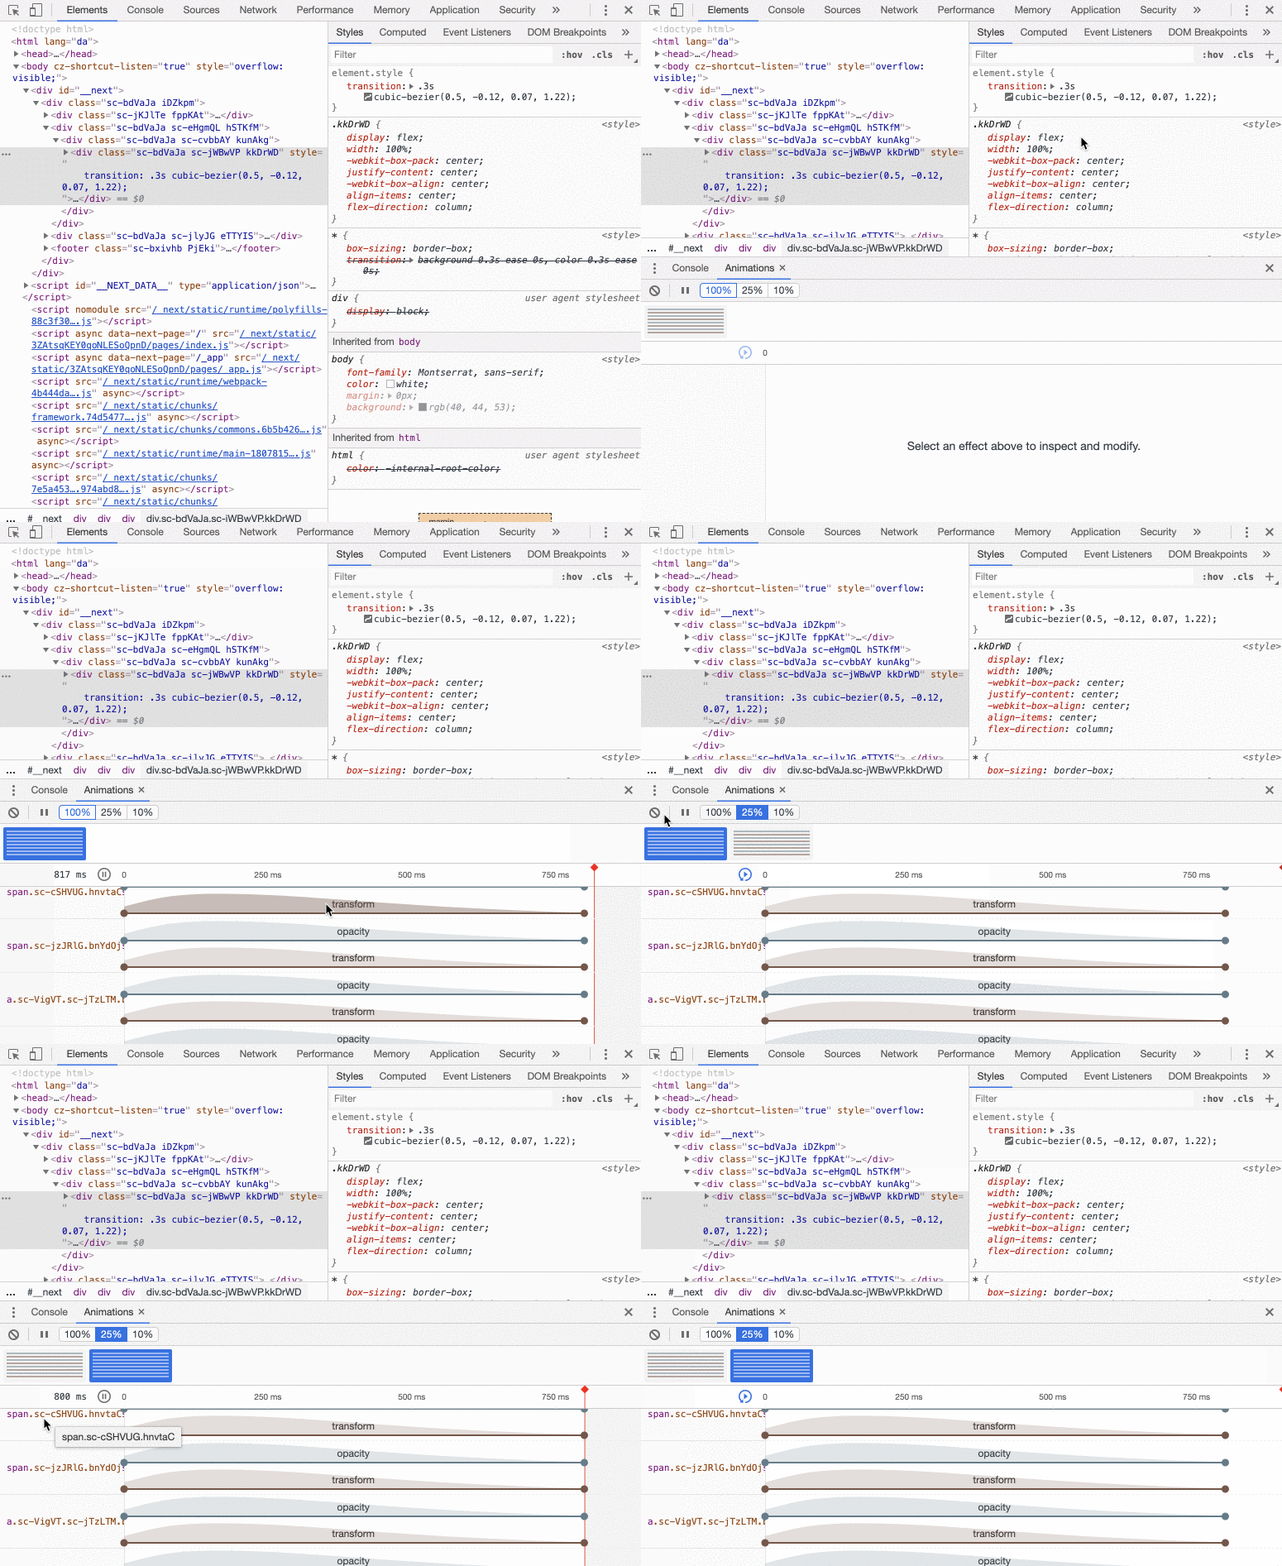
If you have an animation on you site or on another site where you want to inspect how to animation is, then DevTools also have a tool for that. In the GIF below you have a tab inside DevTools where you can rerun animations, slow down to 25%, 10% of total duration and also differentiate between the different animations occuring on the site. You can also see the properties used in the animation. On my website i use opacity and transform properties to animate my logo. You can see below that the element affected, and how the easing function occurs. Useful tool if you have a more complex animation on your site, and you want to slow down the animation and make sure the timing/coordination is pixel perfect.
Endnotes
Although many of these tips is pretty basic, i hope that you have found some of them useful or at least learned something new. If you have any tip that you find useful in your daily development workflow, the please share in the comment section below.


